CI for performance: Reliable benchmarking in noisy environments
You have some code—whether it’s Python, Rust, Java, or some other language—whose speed you want to measure over time. Ideally you want it to get faster, but at the very least you don’t want to get any slower.
So you write a benchmark, and now you need to run it—but where?
Virtual machines in the cloud can have inconsistent performance: in the end you’re sharing resources with other users. Dedicated hardware helps a lot, but even then you won’t always get results as consistent as one would like, and it’s expensive, complex to manage, or both.
You need a way to measure performance consistently, and ideally anywhere. Using GitHub Actions? You should be able to just run your benchmark on a standard runner. Switching to GitLab CI? You want to get the same results. Testing on your machine? You want to match CI results so you can debug a slowdown.
You just want to know if your code has gotten faster or slower.
And as it turns out, there is a potential solution. Not a perfect solution by any means, but a solution that has successfully been used by a software project installed on billions of devices.
To understand what this benchmarking solution does and how to use it, we’re going to do a deep-dive into how CPU and memory affect your software’s performance. In particular, I’ll cover:
- The pain of getting consistent performance results.
- The criteria we’ll want for a good performance metric.
- An introduction to Cachegrind, the tool that will help you get the consistent metric we need.
- The CPU and memory hardware details Cachegrind emulates, and how they are useful.
- Some differences between Cachegrind and real-world performance, and why I think those differences are OK.
- Configuring Cachegrind for consistent results, and a utility to help you do so.
Or you can skip the educational part if you already know the details, and get straight to the TL;DR.
Grab a cup of tea, get comfortable, and let’s get started!
Consistent benchmarking is hard, and it’s even harder in the cloud
First, let’s define our problem: we want to measure CPU performance of some software, so that we can tell if changes have left it faster, slower, or unchanged. We’re going to deliberately exclude software whose performance is tied to other bottlenecks, like disk I/O.
Second, I’m going to assume you’re benchmarking on Linux, although I believe Cachegrind, the tool we’ll end up using, also runs on macOS.
Our first attempt at measuring performance will be measuring wall clock time, with a program that does some work and then reports how long it took to run. In order to get more consistent results, we’ll start by minimizing two sources of randomness in the results:
- I am disabling Address Space Layout Randomization, a Linux security feature that randomize memory location of code.
You can do this by running your program with
setarchuname -m-R yourprogram --yourargs. - Since this particular program is written in Python, I’m going to set a consistent hashing seed.
Most class instances in Python are dictionaries are under the hood, and dictionaries are used for function call (“frame”) locals.
Dictionaries rely on hashing, and the hash algorithm is randomized at startup—and that leads to variation in performance results.
So I’m doing
export PYTHONHASHSEED=123to set a specific seed hash and get consistent results.
With those preparations done, I went and ran the benchmark using GitHub Actions.
Problem #1: Inconsistent results on a single machine
GitHub Actions might hand you a completely different virtual machine for each workflow it runs. On a single virtual machine I ran the benchmark 5 times, with these results:
Benchmark time for 50000 passes = 0.330872
Benchmark time for 50000 passes = 0.333754
Benchmark time for 50000 passes = 0.330924
Benchmark time for 50000 passes = 0.328752
Benchmark time for 50000 passes = 0.331970
The results have some noise: the longest time elapsed is 1.5% higher than the lowest time elapsed. Now, imagine we introduce a 0.5% slowdown in our code—given the noise is much larger than that slowdown, it will be difficult to notice small regressions. And those small regressions will accumulate over time.
From the other direction, it will also be difficult to implement optimizations that are below the noise threshold, because it will be hard to tell whether it’s an improvement or not.
To be fair, this is probably solvable if we just run the benchmark enough times in a row.
Problem #2: Inconsistent results across machines
A few minutes later, I ran the same workflow again, with GitHub Actions allocating what was (perhaps) a different virtual machine. Here are the second set of results:
Benchmark time for 50000 passes = 0.320113
Benchmark time for 50000 passes = 0.3144
Benchmark time for 50000 passes = 0.308733
Benchmark time for 50000 passes = 0.313596
Benchmark time for 50000 passes = 0.317577
Everything is running faster, even though it’s the exact same code! So now we have noise not just across individual benchmark runs, but also across different machines.
Again, we can try to get an average by running on multiple virtual machines, but that starts getting complicated and slow.
And there’s a lot of noise to filter out.
Brook Heisler, creator of the criterion.rs benchmarking tool for Rust, benchmarked the performance variability on a different CI provider and found that “differences of as much as 50% are common.”
And that was after filtering out four outliers which were 10,000% slower!
So how are we going to fix this noise? Let’s find out!
A preview of the solution
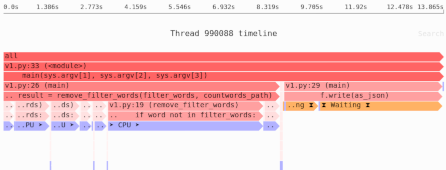
On the same two virtual machines I ran the programs above, I also used a tool called Cachegrind to run the same program multiple times. For the results above I ran:
python benchmark.py
To use Cachegrind, I ran:
valgrind --tool=cachegrind python benchmark.py
Easy peasy!
Now, one of the outputs from Cachegrind is the number of CPU instructions the program ran. And that sounds like a useful proxy for performance, doesn’t it?
Here are the counts from the first VM’s run:
I   refs:      2,270,492,390
I   refs:      2,270,492,380
I   refs:      2,270,492,383
I   refs:      2,270,492,380
I   refs:      2,270,492,381
And here are the numbers from the second run:
I   refs:      2,270,492,391
I   refs:      2,270,492,388
I   refs:      2,270,492,380
I   refs:      2,270,492,384
I   refs:      2,270,492,379
Before were were seeing ~1% noise, whereas these numbers have 0.000001% noise. This is better. Much much much MUCH better.
But is it actually useful? Let’s consider what criteria we want for a performance metric.
The criteria for a useful performance benchmark
In order for a performance metric to be useful we want it to have the following attributes:
- Minimal noise. The whole point of this exercise is to find a more consistent metric than clock time or CPU time, so that small improvements or regressions aren’t overwhelmed by noise.
- A single number. If you get multiple numbers and one goes up and the other goes down, did you improve things? It’s hard to tell. This problem will reoccur once you have multiple benchmarks for the same program, so it’s impossible to get rid of, but there’s no reason to make it worse if we can help it.
- Correlated with real-world performance.
If the performance metric is always
24.5that is a noise-free single number, but it’s not very useful. The whole point is to know whether our software will be faster or slower in the real world.
We’ve already seen that the instruction count from Cachegrind has very low noise. Let’s see if it scales with how many rounds we run the benchmark:
$ valgrind --tool=cachegrind python benchmark.py 20000 2>&1 | grep 'I *refs'
==180846== I   refs:      1,144,847,524
$ valgrind --tool=cachegrind python benchmark.py 40000 2>&1 | grep 'I *refs'
==180850== I   refs:      2,191,929,445
$ valgrind --tool=cachegrind python benchmark.py 80000 2>&1 | grep 'I *refs'
==180860== I   refs:      4,234,593,677
That is pretty much what we’d hope: doubling the work almost doubles the instruction count (“I refs”). It’s almost because there’s also some overhead of just starting Python.
So that’s pretty promising!
Next, we’ll learn more about Cachegrind, and why it might be a good way to measure performance.
Introducing Cachegrind
Cachegrind is one of the tools that come with Valgrind, so let’s start there. The Valgrind documentation explains that when you run a program using one of Valgrind’ s tools:
… [it’s] run on a synthetic CPU provided by the Valgrind core. As new code is executed for the first time, the core hands the code to the selected tool. The tool adds its own instrumentation code to this and hands the result back to the core, which coordinates the continued execution of this instrumented code.
…
Valgrind simulates every single instruction your program executes. Because of this, the active tool checks, or profiles, not only the code in your application but also in all supporting dynamically-linked libraries, including the C library, graphical libraries, and so on.
Cachegrind specifically simulates the CPU’s cache hierarchy. We’ll get to why that’s useful in a bit, but first let’s just focus on the number we’ve been looking at so far: the instruction count, which Cachegrind reports as “I refs”.
When you run a program using Valgrind, it is simulating a CPU. When you’re specifically using the Cachegrind tool, it counts how many instructions are loaded from the CPU caches, which is also how many instructions ran on that CPU. And to a first approximation that’s a pretty decent way to measure CPU performance: less instructions means less work, more instructions means less work.
In fact, the SQLite project mostly uses just this number as their performance metric. This has allowed them accumulate years of micro-optimizations, leading to improved performance. Here’s a graph showing measured instruction use of their benchmark over time; lower is better (source):
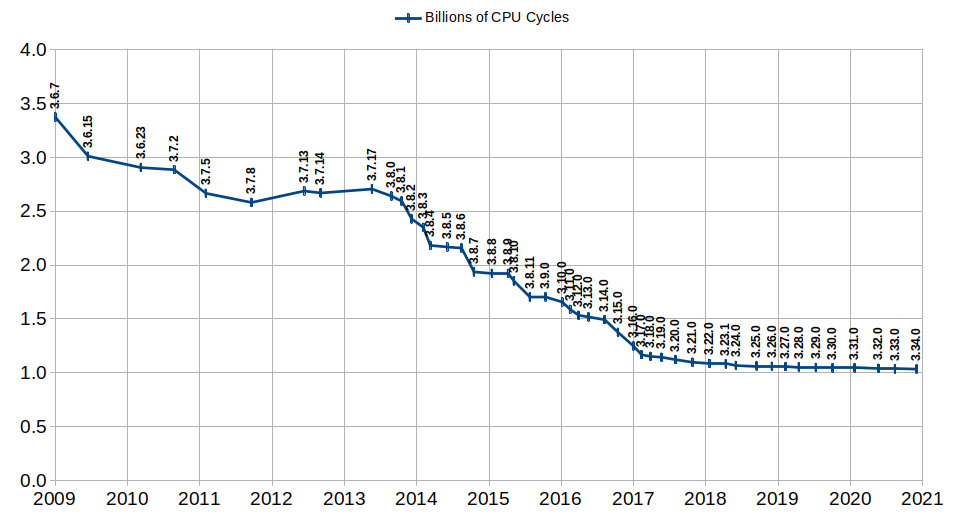
SQLite is (for now) the only project I’ve seen talking about using Cachegrind for benchmarking, but as a piece of software that runs on literally billions of computers they seem worth listening to. I learned about this via an email from Nelson Elhage’s excellent newsletter, which was the inspiration for this write-up. You should subscribe!
Beyond the instruction count, there are other useful numbers Cachegrind provides that we want to take into account if we want to realistically measure performance. So let’s see what they are, and then how we can combine them into a single performance metric.
Here’s a preview of Cachegrind’s default output, slightly edited for clarity:
$ valgrind --tool=cachegrind python benchmark.py 20000
...
warning: L3 cache found, using its data for the LL simulation.

I   refs:      1,149,458,321
I1  misses:        6,071,269
LLi misses:            9,332
I1  miss rate:          0.53%
LLi miss rate:          0.00%

D   refs:        539,298,191
D1  misses:        6,487,280
LLd misses:           78,652
D1  miss rate:           1.2%
LLd miss rate:           0.0%

LL refs:          12,558,549
LL misses:            87,984
LL miss rate:            0.0%
Data and instruction caches
To understand what all that output means, we’re going to have to learn, or at least review, what makes our code run slowly.
To quickly review:
- Accessing RAM is very slow compared to running a CPU instruction like “add two numbers”.
- To speed up memory access, your CPU has a hierarchy of memory caches; my computer has L1, L2, L3 caches.
- Some caches store both data and CPU instructions, some caches store only one or the other.
Cachegrind knows about caches (surprise!)
As you might guess from its name, Cachegrind can simulate the CPUs memory caches; it can tell us about the cache misses that are causing slowness. More accurately, Cachegrind emulates the L1 cache and the last level (LL) cache, in this case meaning the L3 cache.
If you’re not familiar with these concepts, you can learn a bit more in my article about the effects of memory caches on performance. There you will see that random memory access takes more time than linear memory scans, because the random memory access causes many more cache misses. Let’s compare Cachegrind’s output for the linear vs. random memory accesses:
$ valgrind --tool=cachegrind ./memory-cache linear 1000000
...
I   refs:      1,700,573,867
I1  misses:            1,614
LLi misses:            1,593
I1  miss rate:          0.00%
LLi miss rate:          0.00%

D   refs:        400,193,442
D1  misses:       25,006,030
LLd misses:       25,004,602
D1  miss rate:           6.2%
LLd miss rate:           6.2%

LL refs:          25,007,644
LL misses:        25,006,195
LL miss rate:            1.2%

$ valgrind --tool=cachegrind ./memory-cache random 1000000
...
I   refs:      1,700,573,877
I1  misses:            1,614
LLi misses:            1,593
I1  miss rate:          0.00%
LLi miss rate:          0.00%

D   refs:        400,193,444
D1  misses:      399,567,230
LLd misses:      275,112,133
D1  miss rate:          99.8%
LLd miss rate:          68.7%

LL refs:         399,568,844
LL misses:       275,113,726
LL miss rate:           13.1%
That’s a lot of data to digest, so let’s put the key numbers in a table:
| Metric | Linear | Random |
|---|---|---|
| I Refs (CPU instructions) | 1,700,573,867 | 1,700,573,877 |
| D1 miss rate | 6.2% | 99.8% |
| LLd miss rate | 6.2% | 68.7% |
Comparing the number of instructions, we can see they’re almost identical; instruction count is not enough to explain this slowness. But there’s a huge amount of cache misses in the random case, and as we said above, hitting the L3 cache, or even worse RAM, is much slower than the L1 cache.
Combining the metrics into a single number
So far we’ve seen that Cachegrind output isn’t noisy, and the ways in which it can provide realistic performance numbers, both for CPU instructions and slow cache hits. But interpreting this data involves looking at multiple numbers, as in the table above.
Ideally we’d like to combine the multiple numbers into a single number. Having the detailed information is useful, but having a single number makes it easier to see if you’re getting better or worse.
The trick is to combine the cost of L1/D1 access with the cost of the LL cache with the cost of RAM access. The formula I came up with that matches my Haswell Xeon pretty well is:
(L1 + D1 hits) + 5 × (LL hits) + 35 × (RAM hits)
Those ratios will differ for different hardware, but as long as the ratios are approximately correct that’s good enough to be useful.
To see how good these metrics are, I ran the memory-cache program we used above in random mode, across a range of array sizes.
As a reminder, the program bounces around reading and writing to random locations in a set of 4 arrays.
The bigger the array, the less likely the data is cached, leading to expensive L3 or RAM cache misses.
I then compared the wallclock time of the program with the combined performance metric using the above formula, normalized with the slowest runtime set to 1. The goal is to see how correlated the Cachegrind metric is with real-world performance.
Here’s what the result looks like; a “relative slowness” of 2 means that run was twice as slow—higher is worse:
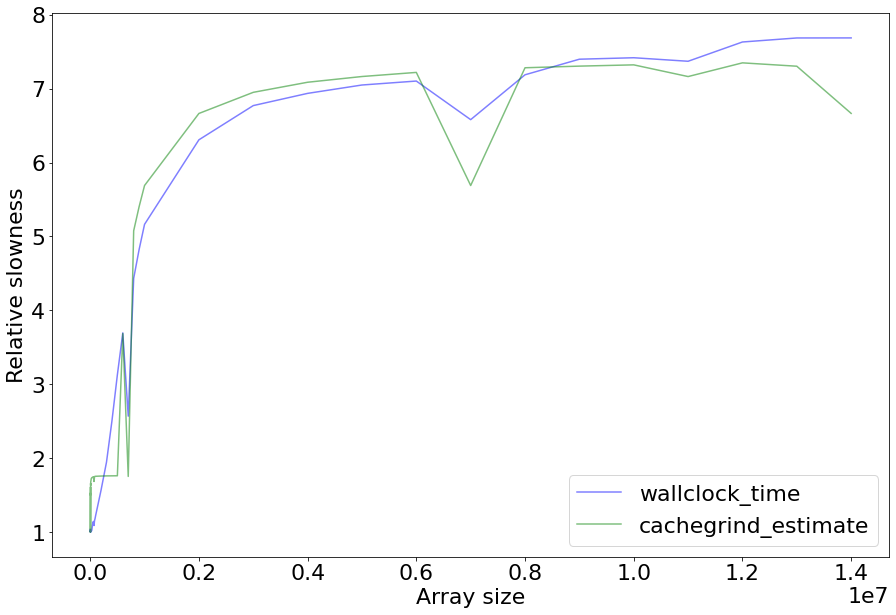
It’s not perfect, but unexpected ups and downs track together. The main place where things go wrong is right at the start, where the formula overestimates slowness because it’s assuming L1 cache misses are going to the L3 cache, when in the real world they’re going to the faster L2 cache.
And remember, unlike the wallclock time that can be quite noisy (my first run was garbage and had to be redone), the results from Cachegrind are going to be very consistent.
Note 1: An earlier version of this article had a multiplier 30 for RAM hits; due to a bug in how I calculated the number of LL hits, the results were slightly different and needed adjustment for more accurate numbers.
Note 2: The KCacheGrind GUI has its own variation on the above formula, described here. It includes branch misses, which I deliberately don’t because it’s so detached from reality. The discussion explains some of the limitations of this approach in more knowledgeable detail than I can provide, but concludes that it’s still worth having a single number. Simplified to actually available data, and omitting branch misses, the equivalent formula KCacheGrind uses is
(L1 + D1 hits) + 10 × (LL hits) + 100 × (RAM hits).Which one is more accurate? In practice, both will be somewhat wrong depending on your hardware, and it will still overestimate the cost of L1 cache misses. Basically, while a single number is useful, minor L1 cache misses aren’t a big deal, and so if you doing significant optimization work you’ll want to look at all the metrics individually, as well as a real metrics from something like
perf stat.
Some limitations to Cachegrind
Cachegrind is not perfect, of course.
- It’s slow: Running under Cachegrind will slow your program down a lot. On the plus side, the reliable results mean you won’t have to do multiple runs.
- No L2 cache: As we saw in the graph above, this can give overly pessimistic results where real code would hit the L2 cache.
- The cache simulation is very inaccurate. Newer CPUs work rather differently than how Cachegrind does.
- Branch (mis)prediction: Another cause for slowness is the CPU mispredicting which branch an
ifstatement (or equivalent) will take. Cachegrind can simulate a branch predictor circa 2004, but modern CPUs are much much better, to the point where Cachegrind’s report is useless. On the plus side, modern CPUs are much better at it, so you’re less likely to hit this slowdown. - Instructions are not actually uniform: Not all instructions take the same amount of time to execute.
- Instruction counts aren’t an accurate measure of performance: Modern CPUs will use instruction parallelism and SIMD, and merely counting the number of instructions can significantly distort the performance result for well-tuned code.
- And more: A few more issues are listed in the Cachegrind documentation.
I also haven’t done any testing of concurrency, though it might work just fine.
It probably won’t give you as good information as perf stat (see below) if you’re, say, hand-tuning your code for instruction-level parallelism.
So if you’re optimizing your algorithm’s hot inner loops, you’ll want to use to use other tools.
Nonetheless, as a really big picture measure, Cachegrind may work for your use case. And an imperfect but useful benchmark is far better than no benchmarks at all.
Alternatives
Are there are alternatives to Cachegrind? Here’s the ones I’ve seen:
Callgrind
Callgrind is another variation of Cachegrind, with the added abilities to:
- Simulate memory pre-fetching, for a slightly more realistic simulator.
- Track which functions called which other functions.
- Turn profiling on and off (see e.g. this Python API).
So it’s probably an easy replacement for Cachegrind, with the same basic tradeoffs but more functionality.
perf stat
The Linux perf stat command will give you similar information to Cachegrind, except that it’s getting it from a real CPU, so it’s much more accurate, and doesn’t cause a slowdown to the extent Cachegrind does.
The downside is that it’s CPU-specific, which means you’ll get different results on different CPUs, at least for cache misses. And CI runners in the cloud don’t guarantee consistent hardware. For example, GitHub Actions says it uses Standard_DS2_v2 Azure instances, and if you look at the relevant Azure docs it seems this involves 4 different CPU models, across 4 generations of Intel generations, with differing L2 and L3 cache sizes.
Also, while I haven’t verified this, it seems that as of December 2020 GitHub Action runners don’t support giving you perf events.
I recommend verifying this on your own, it might change.
On cloud VMs more broadly you’re also sharing hardware with other VMs, which can impact cache usage. For example, here is some empirical research where they tried to measure cache sizes on cloud instances over time, and it’s noisy, especially for L3 (slide 22). Seems like if it was just about CPU models you wouldn’t see that level of variation.
Valgrind alternatives
There are quite a number of CPU cache simulators, some of them much more realistic than Valgrind.
- DynamoRIO is an alternative to Valgrind that has a Cachegrind equivalent, but with more features like hardware prefetch. Unfortunately it appears to be quite slow, though I haven’t tested this myself.
- gem5 appears to be potentially far more accurate, and someone has created a configuration that matches Intel Skylake.
- Here is a survey paper covering even more.
Configuring your run for consistency
So how do you use Cachegrind to get consistent results on a noisy VM?
- You’ll want a stable test environment in terms of software; thanks to Cachegrind, hardware matters a lot less. Something like Ubuntu LTS, RedHat Enterprise Linux, or Debian Stable are needed so things don’t change out from under you in an uncontrolled way. You may wish to test the effects of upgrading libraries or compilers, of course, in a controlled manner.
- Make sure you have a consistent version of Cachegrind.
- Disable ASLR.
- Disable other sources of randomness, e.g. hash seeds in Python.
- Configure Cachegrind to use consistent cache sizes. By default it copies from current machine’s hardware, which means different CPUs will give you different results.
You’ll also need to calculate the overall metric, which involves interpreting the output from Cachegrind; the default output doesn’t actually tell you outright how many L1 hits there are, for example.
In order to make the above easier, I’ve written a script that gives you the overall number. It also disables ASLR and sets consistent cache sizes. You can find it at https://github.com/pythonspeed/cachegrind-benchmarking.
Go forth and benchmark!
Is your software getting faster or getting slower? Lacking benchmarks, you can’t tell.
I am now fairly optimistic that using the script I’ve written to drive Cachegrind you can get a realistic, stable performance number that will tell you if things are getting better or worse—with very little noise.
So go off and write a short benchmark, start running it in CI, and see what it tells you over time. And when you do, I’d love to hear if it works for you, and what you’ve learned.
Credits: Thanks to Nelson Elhage for inspiring and reviewing this article, and to the SQLite team for documenting their idea. Thanks to commenters on lobst.rs who pointed out that KCachegrind has its own formula, pointed me at gem5, and asked a bunch of helpful questions.