Logging for scientific computing: debugging, performance, trust
This is a prose version of a talk I gave at PyCon 2019; you can also watch a video of the talk.
You’ve run your batch process with your scientific model, and after hours and hours it spit out a result. And the result is wrong.
You suspect there’s a bug in the calculation, you’re not sure what it is, and the slow feedback cycle is making debugging even harder. Wouldn’t it be great if you could debug and speed up your program without having to spend days running it just to reproduce your problem?
Now, I’m not a scientist, I’m a software engineer. But I did spend a year and a half working on scientific computing, and based on that experience I’d like to offer a potential solution to this cluster of problems: logging, and in particular a logging library I and my coworkers found very helpful.
But before I get to the solution, it’s worth considering where these problems come from: the specific characteristics of scientific computing.
The nature of scientific computing
For our purposes, scientific computing has three particular characteristics:
- Logic: It involves complex calculations.
- Structure: Computation involves processing data and spitting out results, which implies long-running batch processes.
- Goal: The most fundamental characteristic—scientific computing’s goal is to make an inference about reality. For example, a meteorologist’s model might suggest that it’s going to rain on Tuesday.
Three problems with scientific computing
Each of these characteristics comes with a corresponding problems to be solved:
- Logic: Why is your calculation wrong? With complex calculations, this can be hard to determine.
- Structure: Why is your code slow? With slow batch processes, slow code is even more painful than usual.
- Goal: You’re making an inference about reality—can you really trust the results?
In the rest of this article you’ll see how logging can help address each of these problems.
Problem #1: Why is your calculation wrong?
Your batch process is finally done—it only took 12 hours—and the result is obviously wrong 🤦.
Even worse, this sort of situation often only happens when you’re using real data, so it’s hard to reproduce with tests. And you can’t step through the code with a debugger in a process that takes 12 hours to run!
What you need is a record of what the batch process actually did when it ran. Which is to say, you need logging of:
- Which functions called which other functions.
- Functions’ inputs and outputs.
- Intermediate values as well
My preferred way of adding logging to scientific computing is the Eliot logging library, which I started working on in 2014. Eliot works very differently than most logging libraries, and while it was originally designed for distributed systems, it’s ideal for scientific computing as well.
To see why, let’s look at an example.
Example: a broken program
Consider the following program:
def add(a, b):
    # ... implementation ...

def multiply(a, b):
    # ... implementation ...

def multiplysum(a, b, c):
    return multiply(add(a, b), c)

print(multiplysum(1, 2, 4)) # (1 + 2)*4⇒12
As the comment says, we expect the output to be 12.
But when we run it:
$ python badmath.py
0
We got 0, not 12—something is wrong with the code.
So we add some logging using Eliot:
- Some boilerplate to tell it to output logs to
out.log. - A
@log_calldecorator that logs inputs and outputs for each function.
Eliot has additional, more sophisticated APIs, but we won’t go into those here.
from eliot import log_call, to_file
to_file(open("out.log", "w"))

@log_call
def add(a, b):
    # ... implementation ...

@log_call
def multiply(a, b):
    # ... implementation ...

# etc.
Now that we’ve added logging, we can run the program, and then visualize the results with the eliot-tree program:
$ python badmath.py
0
$ eliot-tree out.log
80bee1e8-7e95-43f9-a7d1-8c06fcb43334
└── multiplysum/1 ⇒ started 2019-05-01 20:54:57 ⧖ 0.001s
    ├── a: 1
    ├── b: 2
    ├── c: 4
    ├── add/2/1 ⇒ started 2019-05-01 20:54:57 ⧖ 0.000s
    │   ├── a: 1
    │   ├── b: 2
    │   └── add/2/2 ⇒ succeeded 2019-05-01 20:54:57
    │       └── result: 3
    ├── multiply/3/1 ⇒ started 2019-05-01 20:54:57 ⧖ 0.000s
    │   ├── a: 3
    │   ├── b: 4
    │   └── multiply/3/2 ⇒ succeeded 2019-05-01 20:54:57
    │       └── result: 0
    └── multiplysum/4 ⇒ succeeded 2019-05-01 20:54:57
        └── result: 0
If you look at the logs, you’ll see a tree of actions:
multiplysum()takes three inputs (1,2, and4).- It calls
add()with arguments1and2, and gets back3. - It then calls
multiply()with arguments3and4, and gets back0. 0is therefore the final result ofmultiplysum().
And now you can see where the bug is: in the multiply() function, since 3×4 is definitely not 0.
In short, Eliot’s model of logging as a forest of actions means you can trace the flow of logic and data through your computation.
Problem #2: Why is your code slow?
The second problem you might is slow computation—remember that 12 hour batch job? The usual solution for performance optimization is profiling, but profilers have some limitations:
- They typically only support a single process, not distributed systems. Many scientific computing jobs are large scale multi-core computations, not just a single thread.
- They can’t tell you which inputs are slow.
f()may be fast on some inputs, but very slow on others—but a profiler just tells you thatf()is slowish on average.
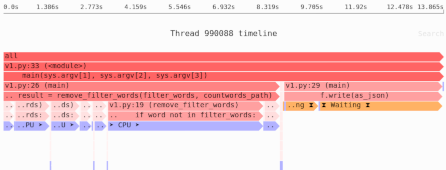
Eliot can help here as well. First, because it supports tracing across multiple processes, including built-in support for the Dask parallel computing framework.
Better yet, Eliot can tells you the elapsed time and inputs to actions traced in the logs.
Example: When is double() slow?
Consider the following slow program:
@log_call
def main():
    A = double(13)
    B = double(0)
    C = double(4)
    return A * B * C

main()
Given its simplicity, we know that slowness is due to double(), but in a more complex program we could get a profiler to tell us that.
But which particular input to double() causes the slowness—one of them? All of them?
We run the program with Eliot, and then extract the logs only for the double action:
$ python slow.py
$ eliot-tree out.log | grep -A1 double.*started
    ├── double/2/1 ⇒ started 2019-04-24 19:17:00 ⧖ 0.0s
    │   ├── a: 13
--
    ├── double/3/1 ⇒ started 2019-04-24 19:17:00 ⧖ 10.0s
    │   ├── a: 0
--
    ├── double/4/1 ⇒ started 2019-04-24 19:17:10 ⧖ 0.0s
    │   ├── a: 4
We can see that double() took almost no time at all for inputs 13 and 4—but a very long time for an input of 0.
By recording the elapsed time for actions, as while as their inputs, Eliot can help you pinpoint which inputs are causing slowness.
Problem #3: Can you trust your code?
The final problem is trust—before you share your tool or its results, you need to trust that it’s actually doing what it ought to. And when you share your tool or your findings, you’ll want other people to trust your argument and results.
Some of the techniques for ensuring trust are:
- Reproducibility: If I run your code and get different results than you, I won’t trust either result.
- Automated testing: Unit tests with simple data, and metamorphic tests for high-level requirements, can add confidence in your software’s correctness.
- Comparisons to real data ad other models: If you’re building a weather model, you can run it on historical data and see how it does, and compare how it does live with other models.
But even with all of these techniques, if your software is an opaque black-box the results are going to be harder to trust. Maybe you’re overfitting to past data. Maybe you’re returning plausible but wrong results.
So to gain trust you also want to provide a coherent explanation of what your software does:
- We did A—
- —here is a graph of intermediate results.
- And then did B—
- —here is a table showing why it makes sense.
- Therefore, we can conclude C.
Explanations with Jupyter
Jupyter is a tool that excels at presenting explanations. You can interleave code execution with visualizations and prose explanations, turning scientific software into a self-explaining narrative.
The problem with Jupyter is that it doesn’t work well with the software engineering approach to writing software. For example:
- It’s much harder to write automated tests for a Jupyter notebook, and so often that never happens.
- Software in a notebook is less reusable, and tends to be less modular.
Explanations with Eliot
Eliot is a different way of explaining how your software works, since it can give you a trace of program execution, with intermediate results of your calculation. And since it’s a logging library, not a way of running software like Jupyter, it integrates well with standard software engineering development practices.
The downside is that the explanations it offers really only make sense to you as the author of your code.
You can’t reasonably share eliot-tree’s output with someone else.
So while it can help you gain trust in your own software, it won’t help you gain other peoples’ trust.
The future: Eliot + Jupyter?
It is possible to do better than either tool on its own. A combination of Eliot and Jupyter could give you a complete trace of the logic of your calculation, loaded into a tool designed for visualization and explanation.
In particular, with some work, it would be possible to take Eliot logs and load them into Jupyter. And while at the moment the Eliot is less suitable for storing large arrays or dataframes, this is a solvable problem.
If this interests you and you want make it happen, please get in touch.
Logging in your scientific computing
Logging will help you:
- Debug your code.
- Speed up your code.
- Understand and trust the results.
Of course, to get these benefits you’ll want to add logging before your batch job starts mysteriously failing. So take a few minutes to learn more about Eliot, and then go add logging to your own software.