Fil: a Python memory profiler for data scientists and scientists
If your Python data pipeline is using too much memory, it can be very difficult to figure where exactly all that memory is going. And when you do make changes, it can be difficult to figure out if your changes helped.
Yes, there are existing memory profilers for Python that help you measure memory usage, but none of them are designed for batch processing applications that read in data, process it, and write out the result.
What you need is some way to know exactly where peak memory usage is, and what code was responsible for memory at that point. And that’s exactly what the Fil memory profiler does.
To explain the motivation behind creating a new memory profiler, this article will cover:
- Why data processing applications have specific memory measurement needs, different than those of a web applications and other servers.
- Why existing tools aren’t sufficient.
- Introduce Fil, an open source memory profiler that solves these issues.
Data pipelines and servers: two different use cases
A data pipeline in this context means a batch program that reads some data, processes it, and then writes it out. This is quite different from a server: a server runs forever, a data processing program will finish eventually.
Because of this difference in lifetime, the impact of memory usage is different.
- Servers: Because they run forever, memory leaks are a common cause of memory problems. Even a small amount of leakage can add up over tens of thousands of calls. Most servers just process small amounts of data at a time, so actual business logic memory usage is usually less of a concern.
- Data pipelines: With a limited lifetime, small memory leaks are less of a concern with pipelines. Spikes in memory usage due to processing large chunks of data are a more common problem.
This is Fil’s primary goal: diagnosing spikes in memory usage.
Why existing tools aren’t sufficient
The first thing to realize is that reducing memory usage is a fundamentally different problem than reducing CPU usage.
Imagine a program that is mostly using just a little CPU, then for one millisecond spikes to using all cores, then is idle for a while more. Using lots of CPU briefly is not a problem, and using lots of CPU for a long period of time isn’t always a problem either—your program will take longer to finish, and that may be fine
But if your program uses 100MB RAM, spikes to 8GB RAM for a millisecond, and then goes back to 100MB RAM, you must have 8GB of RAM available. If you don’t, your program will crash, or start swapping and becomes vastly slower.
For data pipelines, what matters is the moment in time where the process memory usage is highest. And unfortunately, existing tools don’t really expose this in an easy way.
Fil is designed to find the moment of peak memory usage.
In addition, data scientists and scientists are likely to be using libraries that aren’t always written with Python in mind.
Python’s built-in memory tracing tool, tracemalloc, can only track code that uses Python’s APIs.
Third party C libraries often won’t do that.
In contrast, Fil captures all allocations going both to the standard C memory allocation APIs and via Python’s memory allocation APIs.
Fil: maximizing information, minimizing overhead
Consider the following code:
import numpy as np

def make_big_array():
    return np.zeros((1024, 1024, 50))

def make_two_arrays():
    arr1 = np.zeros((1024, 1024, 10))
    arr2 = np.ones((1024, 1024, 10))
    return arr1, arr2

def main():
    arr1, arr2 = make_two_arrays()
    another_arr = make_big_array()

main()
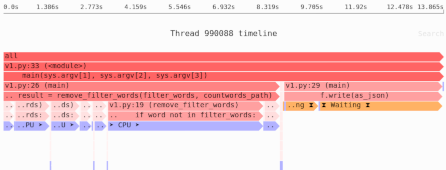
If you run it under Fil, you will get the following flame chart—the wider (or redder) the frame, the higher percentage of memory that function was responsible for. Each line is an additional call in the callstack.
If you double click on a frame you’ll be able to see a zoomed in view of that part of the callstack. Hover over a frame to get additional stats.
Notice you can see complete tracebacks showing where each allocation came from, at the moment of peak memory usage. You can see the more significant NumPy usage, wider and redder, but also the minimal overhead of Python importing modules, the tiny and very pale frames on the left. Visually you can see which code allocations were more significant.
With Fil can see exactly where the peak memory was allocated. Beyond giving this information, Fil was designed with two goals in mind:
- Easy to use: Currently there are no configuration options, and I hope to keep it that way. The goal is to make it Just Work.
- As fast as possible: Tracking every single allocation is very useful, but does add some overhead. So far I’ve gotten to the point where programs running under Fil run at about 50% of normal speed, though it can actually do much better if your program’s computation is heavily C focused and it only does large allocations.
Why not sampling?
An alternative to capturing all allocations is to use sampling, which would give good results for large allocation sites but would omit or introduce errors into smaller allocation sites. Since Fil is designed to be used during development, where you might be testing with smaller datasets, I chose to have it capture all allocations.
That does come with the cost of higher performance overhead. In development this may be fine, in production it’s certainly not. If you want low-overhead profiling, I’ve also created Sciagraph, a performance and memory profiler for data science and scientific computing. Sampling allows Sciagraph to run with extremely low overhead, which is important in production. And in production, or really anytime you’re loading a sufficient large amount of data, sampling isn’t a problem: if your program uses hundreds of megabytes of memory, an error margin around allocation sites of less <1MB is fine.
Try it out today
Want to profile your code’s memory use?
First, install Fil (Linux and macOS only at the moment) either with pip inside a virtualenv:
$ pip install --upgrade pip
$ pip install filprofiler
Or with Conda:
$ conda install -c conda-forge filprofiler
Then, if you usually run your program like this:
$ python yourscript.py --load-file=yourfile
Just run:
$ fil-profile run yourscript.py --load-file=yourfile
It will pop-up a browser page with the information you need to reduce memory usage. It’s that easy!
If you have any questions, feature requests, or bug reports, please send me an email or file an issue in the GitHab tracker.