Debugging Python server memory leaks with the Fil profiler
Your server is running just fine, handling requests and sending responses. But then, ever so slowly, memory usage creeps up, and up, and up–until eventually your process runs out of memory and crashes. And then it restarts, and the leaking starts all over again.
In order to fix memory leaks, you need to figure out where that memory is being allocated. And that can be tricky, unless you use the right tools.
Let’s see how you can identify the exact lines of code that are leaking by using the Fil memory profiler.
A trivial leaky server
In order to simulate a memory leak, I’m going to be running the following simple Flask server:
from flask import Flask

app = Flask(__name__)

cache = {}

@app.route("/<page>")
def index(page):
    if page not in cache:
        cache[page] = f"<h1>Welcome to {page}</h1>"
    return cache[page]


if __name__ == "__main__":
    app.run()
This is a simplified example of caching an expensive operation so it only has to be run once. Unfortunately, it doesn’t limit the size of the cache, so if the server starts getting random queries, the cache will grow indefinitely, thus leaking memory.
Since this is a trivial example, you can figure out the memory leak in this code simply by reading it, but in the real world it’s not so easy. That’s where profilers come in.
Let’s see the leak in action, and then see how Fil can help you spot it.
Simulating traffic
In order to trigger the leak, we’ll send a series of random requests to the server using the following script:
from random import random
from requests import get

while True:
    get(f"http://localhost:5000/{random()}")
If we run the server using psrecord, and run this random request script, we can see how memory grows over time:
$ psrecord --plot memory.png "python leaky.py"
Here’s what the CPU and memory usage looks like after sending traffic to the server for a while:
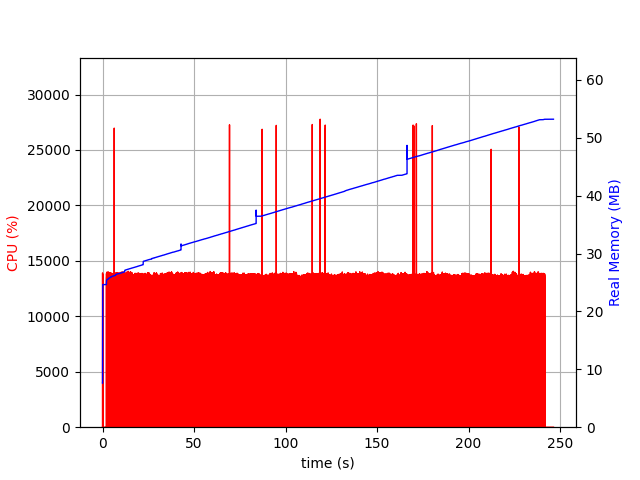
As you can see, the more queries, the more memory usage goes up.
Finding the leak with Fil
So what code exactly is causing the leak? For a real application with a large code base, figuring this out can be quite difficult.
This is where Fil comes in. Fil is a memory profiler that records the peak memory usage of your application, as well as which code allocated it. While Fil was designed for scientific and data science applications, it turns out that recording peak memory works quite well for detecting memory leaks as well.
Consider the memory usage graph above. If you have a memory leak, the more time passes, the higher memory usage is. Eventually memory use is dominated by the leak–which means inspecting peak memory usage will tell us where the memory leak is.
After installing Fil by doing pip install filprofiler or conda install -c conda-forge filprofiler, I can run the program under Fil, and again generate some simulated traffic:
$ fil-profile run leaky.py
=fil-profile= Memory usage will be written out at exit, and opened automatically in a browser.
=fil-profile= You can also run the following command while the program is still running to write out peak memory usage up to that point: kill -s SIGUSR2 1285041
 * Serving Flask app "__init__" (lazy loading)
 * Environment: production
   WARNING: This is a development server. Do not use it in a production deployment.
   Use a production WSGI server instead.
 * Debug mode: off
 * Running on http://127.0.0.1:5000/ (Press CTRL+C to quit)127.0.0.1 - - [06/Aug/2020 10:57:29] "GET /0.8582927186632662 HTTP/1.1" 200 -
127.0.0.1 - - [06/Aug/2020 10:57:29] "GET /0.04644592969681438 HTTP/1.1" 200 -
127.0.0.1 - - [06/Aug/2020 10:57:29] "GET /0.7531563433260747 HTTP/1.1" 200 -
127.0.0.1 - - [06/Aug/2020 10:57:29] "GET /0.6687347621524576 HTTP/1.1" 200 -
...
Eventually I hit Ctrl-C, and get the following report:
If you follow the widest, reddest frames towards the bottom of the graph, you’ll see that line 11 of leaky.py, the line that generates the HTML and adds it to the cache, is responsible for 47% of the memory usage.
The longer the server runs, the higher that percentage will be.
If you click on that frame, you’ll also get the full traceback.
Next steps
If you want to try this yourself, make sure you’re using Fil 0.9.0 or later (which in return requires pip version 19 or later).
Older versions of Fil are much slower and have much more memory overhead when profiling code that does lots of allocations.
There are some caveats to using Fil:
- There is some overhead: it runs 2-3× as slowly depending on the workload.
- You need to run the program under Fil, you can’t attach to already running processes.
Nonetheless, if you’re trying to debug a memory leak in your server, do give Fil a try: it will help you spot the exact parts of your application that are leaking.