Profiling in Jupyter
To measure peak memory usage of some code in Jupyter you need to do three things:
Using Fil in Jupyter
1. Use “Python 3 with Fil” kernel
Jupyter notebooks run with a particular “kernel”, which most of the time just determines which programming language the notebook is using, like Python or R. Fil support in Jupyter requires a special kernel, so instead of using the “Python 3” kernel you’ll use the “Python 3 with Fil” kernel.
There are two ways to choose this kernel:
- You can choose this kernel when you create a new notebook.
- You can switch an existing notebook in the Kernel menu. There should be a “Change Kernel” option in there in both Jupyter Notebook and JupyterLab.
2. Load the extension
In one of the cells in your notebook, add this to the cell:
%load_ext filprofiler
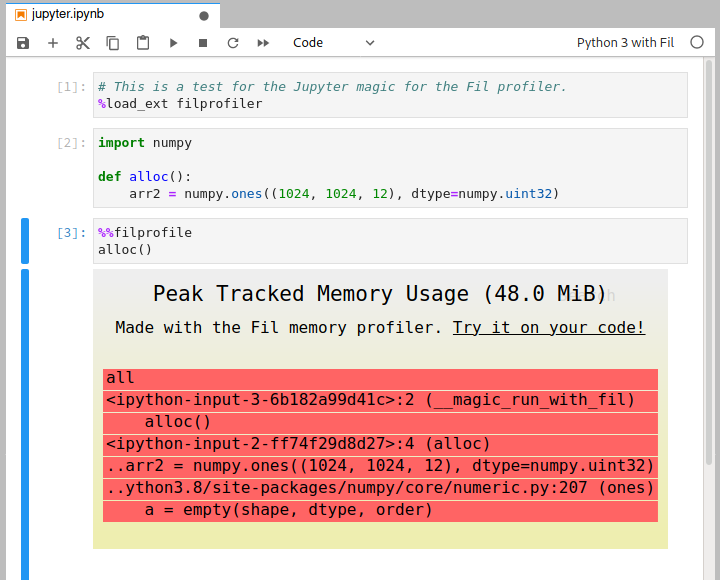
3. Profiling a particular cell
You can now do memory profiles of particular cells by adding %%filprofile as the first line of the cell.
- Load the extension by doing
%load_ext filprofiler. - Add the
%%filprofilemagic to the top of the cell with the code you wish to profile.
An example
Here’s an example session: