Fil: A memory profiler for Python on Linux and macOS
Your Python code reads some data, processes it, and uses too much memory; maybe it even dies due to an out-of-memory error. In order to reduce memory usage, you first need to figure out:
- Where peak memory usage is, also known as the high-water mark.
- What code was responsible for allocating the memory that was present at that peak moment.
That’s exactly what Fil will help you find. Fil an open source memory profiler designed for data processing applications written in Python, and includes native support for Jupyter.
Fil is open source, and is designed for offline profiling. It has enough of a performance impact that you won’t want to use it on production workloads, but it can profile even small amounts of memory.
If you want memory (and performance!) profiling for your Python batch jobs in production, consider using Sciagraph.
Getting started with Fil
In this section you’ll learn how to:
Installing Fil
Fil requires macOS or Linux, and Python 3.7 or Later. You can either use Conda, a sufficiently new version of Pip, or higher-level tools like Poetry or Pipenv.
Conda
To install on Conda:
$ conda install -c conda-forge filprofiler
Pip (or similar tools)
To install the latest version of Fil you’ll need Pip 19 or newer. You can check the current version like this:
$ pip --version
pip 19.3.0
If you’re using something older than v19, you can upgrade by doing:
$ pip install --upgrade pip
If that doesn’t work, try running your code in a virtualenv (always a good idea in general):
$ python3 -m venv venv/
$ source venv/bin/activate
(venv) $ pip install --upgrade pip
Assuming you have a new enough version of pip, you can now install Fil:
$ pip install filprofiler
Using Fil for the first time
First, install Fil.
Then, create a Python file called example.py with the following code:
import numpy as np

def make_big_array():
    return np.zeros((1024, 1024, 50))

def make_two_arrays():
    arr1 = np.zeros((1024, 1024, 10))
    arr2 = np.ones((1024, 1024, 10))
    return arr1, arr2

def main():
    arr1, arr2 = make_two_arrays()
    another_arr = make_big_array()

main()
Now, you can run it with Fil:
$ fil-profile run example.py
This will run the program under Fil, and pop up the results.
In the next section, we’ll look at the results and see what they tell us.
Understanding Fil’s output
Let’s look at the result of the Fil run from the previous section:
What does this mean?
What you’re seeing is a flamegraph, a visualization that shows a tree of callstacks and which ones were most expensive. In Fil’s case, it shows the callstacks responsible for memory allocations at the point in time when memory usage was highest.
The wider or redder the frame, the higher percentage of memory that function was responsible for. Each line is an additional call in the callstack.
This particular flamegraph is interactive:
- Click on a frame to see a zoomed in view of that part of the callstack. You can then click “Reset zoom” in the upper left corner to get back to the main overview.
- Hover over a frame with your mouse to get additional details.
To optimize your code, focus on the wider and redder frames.
These are the frames that allocated most of the memory.
In this particular example, you can see that the most memory was allocated by a line of code in the make_big_array() function.
Having found the source of the memory allocations at the moment of peak memory usage, you can then go and reduce memory usage. You can then validate your changes reduced memory usage by re-running your updated program with Fil and comparing the result.
Understanding Fil
In this section you’ll learn:
Fil vs other Python memory tools
There are two distinct patterns of Python usage, each with its own source of memory problems.
In a long-running server, memory usage can grow indefinitely due to memory leaks. That is, some memory is not being freed.
- If the issue is in Python code, tools like
tracemallocand Pympler can tell you which objects are leaking and what is preventing them from being leaked. - If you’re leaking memory in C code, you can use tools like Valgrind.
Fil, however, is not specifically aimed at memory leaks, but at the other use case: data processing applications. These applications load in data, process it somehow, and then finish running.
The problem with these applications is that they can, on purpose or by mistake, allocate huge amounts of memory. It might get freed soon after, but if you allocate 16GB RAM and only have 8GB in your computer, the lack of leaks doesn’t help you.
Fil will therefore tell you, in an easy to understand way:
- Where peak memory usage is, also known as the high-water mark.
- What code was responsible for allocating the memory that was present at that peak moment.
- This includes C/Fortran/C++/whatever extensions that don’t use Python’s memory allocation API (
tracemalloconly does Python memory APIs).
This allows you to optimize that code in a variety of ways.
How Fil works
Fil uses the LD_PRELOAD/DYLD_INSERT_LIBRARIES mechanism to preload a shared library at process startup.
This is why Fil can’t be used as regular library and needs to be started in a special way: it requires setting up the correct environment before Python starts.
This shared library intercepts all the low-level C memory allocation and deallocation API calls, and keeps track of the corresponding allocation.
For example, instead of a malloc() memory allocation going directly to your operating system, Fil will intercept it, keep note of the allocation, and then call the underlying implementation of malloc().
At the same time, the Python tracing infrastructure (the same infrastructure used by cProfile and coverage.py) is used to figure out which Python callstack/backtrace is responsible for each allocation.
How to use Fil
In this section you will learn how to use Fil to profile:
- Complete Python programs.
- Cells in Jupyter notebooks.
- Parts of your program using Fil’s Python API.
You will also learn how to use Fil to debug:
Profiling complete Python programs
You want to get a memory profile of your Python program end-to-end, from when it starts running to when it finishes.
Profiling Python scripts
Let’s say you usually run your program like this:
$ python yourscript.py --input-file=yourfile
Just do:
$ fil-profile run yourscript.py --input-file=yourfile
And it will generate a report and automatically try to open it in for you in a browser.
Reports will be stored in the fil-result/ directory in your current working directory.
You can also use this alternative syntax:
$ python -m filprofiler run yourscript.py --input-file=yourfile
Profiling Python modules (python -m)
If your program is usually run as a module:
$ python -m yourapp.yourmodule --args
You can run it with Fil like this:
$ fil-profile run -m yourapp.yourmodule --args
Or like this:
$ python -m filprofiler run -m yourapp.yourmodule --args
Profiling in Jupyter
To measure peak memory usage of some code in Jupyter you need to do three things:
Using Fil in Jupyter
1. Use “Python 3 with Fil” kernel
Jupyter notebooks run with a particular “kernel”, which most of the time just determines which programming language the notebook is using, like Python or R. Fil support in Jupyter requires a special kernel, so instead of using the “Python 3” kernel you’ll use the “Python 3 with Fil” kernel.
There are two ways to choose this kernel:
- You can choose this kernel when you create a new notebook.
- You can switch an existing notebook in the Kernel menu. There should be a “Change Kernel” option in there in both Jupyter Notebook and JupyterLab.
2. Load the extension
In one of the cells in your notebook, add this to the cell:
%load_ext filprofiler
3. Profiling a particular cell
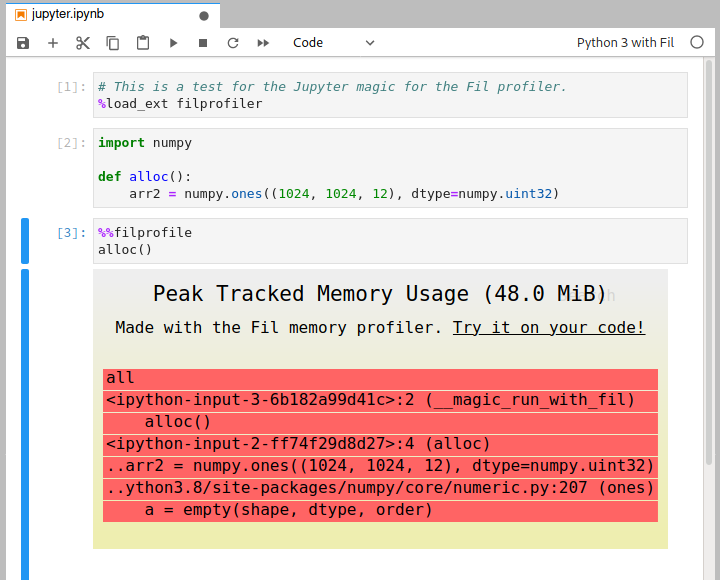
You can now do memory profiles of particular cells by adding %%filprofile as the first line of the cell.
- Load the extension by doing
%load_ext filprofiler. - Add the
%%filprofilemagic to the top of the cell with the code you wish to profile.
An example
Here’s an example session:
Profiling a subset of your Python program
Sometimes you only want to profile your Python program part of the time. For this use case, Fil provides a Python API.
Important: This API turns profiling on and off for the whole process! If you want more fine grained profiling, e.g. per thread, please file an issue.
Using the Python API
1. Add profiling in your code
Let’s you have some code that does the following:
def main():
    config = load_config()
    result = run_processing(config)
    generate_report(result)
You only want to get memory profiling for the run_processing() call.
You can do so in the code like so:
from filprofiler.api import profile

def main():
    config = load_config()
    result = profile(lambda: run_processing(config), "/tmp/fil-result")
    generate_report(result)
You could also make it conditional, e.g. based on an environment variable:
import os
from filprofiler.api import profile

def main():
    config = load_config()
    if os.environ.get("FIL_PROFILE"):
        result = profile(lambda: run_processing(config), "/tmp/fil-result")
    else:
        result = run_processing(config)
    generate_report(result)
2. Run your script with Fil
You still need to run your program in a special way. If previously you did:
$ python yourscript.py --config=myconfig
Now you would do:
$ fil-profile python yourscript.py --config=myconfig
Notice that you’re doing fil-profile python, rather than fil-profile run as you would if you were profiling the full script.
Only functions running for the duration of the filprofiler.api.profile() call will have memory profiling enabled, including of course the function you pass in.
The rest of the code will run at (close) to normal speed and configuration.
Each call to profile() will generate a separate report.
The memory profiling report will be written to the directory specified as the output destination when calling profile(); in or example above that was "/tmp/fil-result".
Unlike full-program profiling:
- The directory you give will be used directly, there won’t be timestamped sub-directories.
If there are multiple calls to
profile(), it is your responsibility to ensure each call writes to a unique directory. - The report(s) will not be opened in a browser automatically, on the presumption you’re running this in an automated fashion.
Debugging out-of-memory crashes using Fil
Note: Out-of-memory detection is currently disabled on macOS. This may change in a future release.
Typically when your program runs out of memory, it will crash, or get killed mysteriously by the operating system, or other unfortunate side-effects.
To help you debug these problems, Fil will heuristically try to catch out-of-memory conditions, and dump a report if thinks your program is out of memory. It will then exit with exit code 53.
$ fil-profile run oom.py
...
=fil-profile= Wrote memory usage flamegraph to fil-result/2020-06-15T12:37:13.033/out-of-memory.svg
Fil uses three heuristics to determine if the process is close to running out of memory:
- A failed allocation, indicating insufficient memory is available.
- The operating system or memory-limited cgroup (e.g. a Docker container) only has 100MB of RAM available.
- The process swap is larger than available memory, indicating heavy swapping by the process.
In general you want to avoid swapping, and e.g. explicitly use
mmap()if you expect to be using disk as a backfill for memory.
For a more detailed example of out-of-memory detection with Fil, see this article on debugging out-of-memory crashes.
Disabling the out-of-memory detection
Sometimes the out-of-memory detection heuristic will kick in too soon, shutting down the program even though in practice it could finish running. You can disable the heuristic by doing:
fil-profile --disable-oom-detection run yourprogram.py
Debugging memory leaks with Fil
Is your program suffering from a memory leak? You can use Fil to debug it.
Fil works by reporting the moment in your process lifetime where memory is highest. If your program has a memory leak, eventually the highest memory usage point is always the present, as leaked memory accumulates.
If for example your Python web application is leaking memory, you can:
- Start it under Fil.
- Generate lots of traffic that causes memory leaks.
- When enough memory has leaked that it’s noticeable, cleanly kill the process (e.g. Ctrl-C).
Fil will then dump a report that will help pinpoint the leaking code.
For a more in-depth tutorial, read this article on debugging Python server memory leaks with Fil.
Disabling browser pop-up reports
By default, Fil will open the result of a profiling run in a browser.
As of version 2021.04.2, you can disable this by using the --no-browser option (see fil-profile --help for details).
You will want to view the SVG report in a browser, since they rely heavily on JavaScript.
If you want to serve the report files from a static directory using a web server, you can do:
$ cd fil-result/
$ python -m http.server
Reference
Learn about:
- What Fil tracks.
- How threads are tracked.
- Fil’s behavior impacts on NumPy (BLAS), Zarr, BLOSC, OpenMP, numexpr.
- Known limitations.
- Getting help.
Release notes
2024.11.2 (2024-11-03)
Changes
- Added support for Python 3.13.
2024.11.1 (2024-11-03)
Regressions
- Run with more overhead, in order to support newer versions of Python.
Changes
- Added support for Python 3.12.
- Dropped support for Python 3.7 and 3.8.
2023.3.1 (2023-3-18)
Bugfixes
- Fixed a reentrancy bug that could cause profiling to fail with a BorrowMutError. (#485)
2023.3.0 (2023-3-1)
Changes
- Out-of-memory detection is disabled for now on macOS, since it is prone to false positives.
2023.1.0 (2023-1-20)
Bugfixes
- Fix regression where source code would sometimes be missing from flamegraphs, most notably in Jupyter profiling. (#474)
2022.11.0 (2022-11-07)
Features
- Added initial Python 3.11 support; unfortunately this increased performance overhead a little. (#381)
2022.10.0 (2022-10-19)
Bugfixes
- If
/procis in unexpected format, try to keep running anyway. This can happen, for example, on very old versions of Linux. (#433)
2022.09.3 (2022-09-30)
Bugfixes
- Complex flamegraphs should render faster. (#427)
2022.09.2 (2022-09-29)
Bugfixes
- Hopefully fixed segfault on macOS, on Python 3.7 and perhaps other versions. (#412)
2022.09.0 (2022-09-12)
Features
- Added wheels for ARM on Linux (
aarch64), useful for running native Docker images on ARM Macs. (#395)
2022.07.0 (2022-07-22)
Bugfixes
- Stopped using
jemallocon Linux, for better compatibility with certain libraries. (#389) - Speed up rendering of flamegraphs in cases where there are many smaller allocations, by filtering out allocations smaller than 0.2% of total memory. Future releases may re-enable showing smaller allocations if a better fix can be found. (#390)
2022.06.0 (2022-06-19)
Features
- Added wheels for macOS ARM/Silicon machines. (#383)
2022.05.0 (2022-05-19)
Bugfixes
- Fix a number of potential deadlock scenarios when writing out reports. (#374, #365, #349)
- Give more accurate message when running in no-browser mode (thanks to Paul-Louis NECH). (#347)
2022.03.0 (2022-03-27)
Bugfixes
- Don’t include memory usage from NumPy imports in the profiling output. This is somewhat inaccurate, but is a reasonable short-term workaround. (#308)
- Added explanation of why error messages are printed on macOS when opening browser. (#334)
- The directories where reports are stored now avoid the characters ‘:’ and ‘.’, for better compatibility with other operating systems. (#336)
Deprecations and Removals
- Python 3.6 support was dropped. (#342)
2022.01.1 (2022-01-30)
Bugfixes
- The jemalloc package used on Linux was unmaintained and old, and broke Conda-Forge builds; switched to a newer one. (#302)
2022.01.0 (2022-01-26)
Features
- Reports now have a “open in new tab” button. Thanks to @petergaultney for the suggestion. (#298)
Improved Documentation
- Improved explanations in report of what it is that Fil tracks, and what a flamegraph tells you. (#185)
- Fix bad command name in the API documentation, thanks to @kdebrab. (#291)
Misc
2021.12.2 (2021-12-15)
Bugfixes
- Work on versions of Linux with weird glibc versions. (#277)
2021.12.1 (2021-12-03)
Features
- Build 3.10 wheels for macOS too. (#268)
2021.12.0 (2021-12-03)
Features
- Added Python 3.10 support. (#242)
2021.11.1 (2021-11-19)
Bugfixes
- Added back wheels for macOS Catalina (10.15). (#253)
2021.11.0 (2021-11-08)
Bugfixes
- Fixed crashes on macOS Monterey. (#248)
2021.09.1 (2021-09-27)
Bugfixes
- SIGUSR2 previously did not actually dump memory. Thanks to @gaspard-quenard for the bug report. (#237)
2021.9.0 (2021-09-24)
Bugfixes
- Fix problem on macOS where certain subprocesses (e.g. from Homebrew) would fail to start from Python processes running under Fil. Thanks to @dreid for the bug report. (#230)
2021.8.0 (2021-08-17)
Bugfixes
- Fix Apache Beam (and other libraries that depend on pickling
__main__module) when usingfilprofile run -m. (#202) - Fixed potential reentrancy bugs; unclear if this had any user-facing impacts, though. (#215)
2021.7.1 (2021-07-18)
Bugfixes
- Fixed segfault on some Linux versions (regression in release 2021.7.0). (#208)
2021.7.0 (2021-07-12)
Features
- Added a
--disable-oom-detectionto disable the out-of-memory detection heuristic. (#201)
Bugfixes
- When using the Jupyter
%%filprofilemagic, locals defined in the cell are now stored in the Jupyter session as usual. (#167) - Emulate Python’s module running code more faithfully, to enable profiling things like Apache Beam. (#202)
2021.5.0 (2021-05-06)
Bugfixes
- Fixed bug where certain allocations went missing during thread creation and cleanup. (#179)
2021.4.4 (2021-04-28)
Bugfixes
- Fixed race condition in threads that resulting in wrong allocation being removed in the tracking code. (#175)
2021.4.3 (2021-04-15)
Bugfixes
- Major bugfix: mmap() was usually not added correctly on Linux, and when it was, munmap() was ignored. (#161)
2021.4.2 (2021-04-14)
Features
- Added --no-browser option to disable automatically opening reports in a browser. (#59)
Bugfixes
- Fixed bug where aligned_alloc()-created allocations were untracked when using pip packages with Conda; specifically this is relevant to libraries written in C++. (#152)
- Improved output in the rare case where allocations go missing. (#154)
- Fixed potential problem with threads noticing profiling is enabled. (#156)
2021.4.1 (2021-04-08)
Bugfixes
- Fixed bug where reverse SVG sometimes was generated empty, e.g. if source code used tabs. (#150)
2021.4.0 (2021-04-01)
Bugfixes
- Fil no longer blows up if checking cgroup memory is not possible, e.g. on CentOS 7. (#147)
2021.3.0 (2021-03-19)
Features
- Try to ensure monospace font is used for reports. (#143)
Bugfixes
- Number of allocations in the profiling results are now limited to 10,000. If there are more than this, they are all quite tiny, so probably less informative, and including massive number of tiny allocations makes report generation (and report display) extremely resource intensive. (#140)
- The out-of-memory detector should work more reliably on Linux. (#144)
0.17.0 (2021-03-02)
Features
- Improve error messages when using API in subprocesses, so it’s clear it’s not (yet) possible. (#133)
0.16.0 (2021-02-24)
Bugfixes
- On Linux, use a more robust method of preloading the shared library (requires glibc 2.30+, i.e. a Linux distribution released in 2020 or later). (#133)
- Fixed in regression in Fil v0.15 that made it unusable on macOS. (#135)
- Fewer spurious warnings about launching subprocesses. (#136)
0.15.0 (2021-02-18)
Features
- Fil now supports profiling individual functions in normal Python scripts; previously this was only possible in Jupyter. (#71)
Bugfixes
- Fil now works better with subprocessses. It doesn’t support memory tracking in subprocesses yet, but it doesn’t break them either. (#117)
0.14.1 (2021-01-15)
Features
- Report memory stats when out-of-memory event is detected. (#114)
Bugfixes
- Correctly handle bad data from cgroups about memory limits, fixing erroneous out-of-memory caused by Docker. (#113)
0.14.0 (2021-01-13)
Features
- Out-of-memory detection should work in many more cases than before. (#96)
0.13.1 (2020-11-30)
Features
- Fil now supports Python 3.9. (#83)
0.13.0 (2020-11-27)
Bugfixes
- Fil no longer uses a vast amount of memory to generate the SVG report. (#102)
0.12.0 (2020-11-21)
Bugfixes
- Fixed bug that would cause crashes when thread-local storage destructors allocated or freed memory. Thanks to @winash12 for reporting the issue. (#99)
0.11.0 (2020-11-19)
Features
- Allocations in C threads are now considered allocations by the Python code that launched the thread, to help give some sense of where they came from. (#72)
- It’s now possible to run Fil by doing
python -m filprofilerin addition to running it asfil-profile. (#82) - Small performance improvements reducing overhead of malloc()/free() tracking. (#88 and #95)
Bugfixes
- When running in Jupyter, NumPy/BLOSC/etc. thread pools are only limited to one thread when actually running a Fil profile. This means Fil’s Jupyter kernel is even closer to running the way a normal Python 3 kernel would. (#72)
0.10.0 (2020-08-28)
Features
0.9.0 (2020-08-13)
Features
- When tracking large numbers of allocations, Fil now runs much faster, and has much less memory overhead. (#65)
- Added support for tracking allocations done using
posix_memalign(3). (#61)
Bugfixes
- Fixed edge case for large allocations, where wrong number of bytes was recorded as freed. (#66)
0.8.0 (2020-07-24)
Features
- Switched to using jemalloc on Linux, which should deal better both in terms of memory usage and speed with many small allocations. It also simplifies the code. (#42)
- Further reduced memory overhead for tracking objects, at the cost of slightly lower resolution when tracking allocations >2GB. Large allocations >2GB will only be accurate to a resoluion of ~1MB, i.e. they might be off by approximately 0.05%. (#47)
0.7.2 (2020-07-12)
Bugfixes
- Significantly reduced the memory used to generate the SVG report. (#38)
- Reduced memory overhead of Fil somewhat, specifically when tracking large numbers of small allocations. (#43)
0.7.1 (2020-07-07)
Bugfixes
- Fix bug that prevented Fil from running on macOS Mojave and older. (#36)
0.7.0 (2020-07-03)
Features
- C++ allocations get tracked more reliably, especially on macOS. (#10)
- Validated that Fortran 90 allocations are tracked by Fil. (#11)
Misc
0.6.0 (2020-07-01)
Features
- Anonymous mmap()s are now tracked by Fil. (#29)
0.5.0 (2020-06-22)
Features
- macOS is now supported. (#15)
Bugfixes
- Running
fil-profilewith no arguments now prints the help. (#21)
0.4.0 (2020-06-15)
Features
- Fil now helps debug out-of-memory crashes by dumping memory usage at the time of the crash to an SVG. This feature is experimental.
- Generating the report should run faster.
0.3.3 (2020-06-10)
Features
- Allocations from the
realloc()allocation API are now tracked by Fil.
Bugfixes
- Fix a bug that corrupted the SVGs.
0.3.2 (2020-06-04)
Features
- Hovering over a frame now shows the relevant details on top, where it’s visible.
0.3.1 (2020-05-25)
Bugfixes
- Command-line arguments after the script/module now work. To make it easier to implement, changed the code so you do
fil-profile run script.pyinstead offil-profile script.py.
0.3.0 (2020-05-21)
Features
- The flame graphs now include the actual code that was responsible for memory use.
What Fil tracks
Fil will track memory allocated by:
- Normal Python code.
- C code using
malloc()/calloc()/realloc()/posix_memalign(). - C++ code using
new(including viaaligned_alloc()). - Anonymous
mmap()s. - Fortran 90 explicitly allocated memory (tested with gcc’s
gfortran; let me know if other compilers don’t work).
Still not supported, but planned:
mremap()(resizing ofmmap()).
Maybe someday:
- File-backed
mmap(). The semantics are somewhat different than normal allocations or anonymousmmap(), since the OS can swap it in or out from disk transparently, so supporting this will involve a different kind of resource usage and reporting. - Other forms of shared memory, need to investigate if any of them allow sufficient allocation.
- Anonymous
mmap()s created via/dev/zero(not common, since it’s not cross-platform, e.g. macOS doesn’t support this). memfd_create(), a Linux-only mechanism for creating in-memory files.memalign,valloc(),pvalloc(),reallocarray(). These are all rarely used, as far as I can tell.
Threading in NumPy (BLAS), Zarr, numexpr
In general, Fil will track allocations in threads correctly.
First, if you start a thread via Python, running Python code, that thread will get its own callstack for tracking who is responsible for a memory allocation.
Second, if you start a C thread, the calling Python code is considered responsible for any memory allocations in that thread.
This works fine... except for thread pools. If you start a pool of threads that are not Python threads, the Python code that created those threads will be responsible for all allocations created during the thread pool’s lifetime. Fil therefore disables thread pools for a number of commonly-used libraries.
Behavior impacts on NumPy (BLAS), Zarr, BLOSC, OpenMP, numexpr
Fil can’t know which Python code was responsible for allocations in C threads.
Therefore, in order to ensure correct memory tracking, Fil disables thread pools in BLAS (used by NumPy), BLOSC (used e.g. by Zarr), OpenMP, and numexpr.
They are all set to use 1 thread, so calls should run in the calling Python thread and everything should be tracked correctly.
This has some costs:
- This can reduce performance in some cases, since you’re doing computation with one CPU instead of many.
- Insofar as these libraries allocate memory proportional to number of threads, the measured memory usage might be wrong.
Fil does this for the whole program when using fil-profile run.
When using the Jupyter kernel, anything run with the %%filprofile magic will have thread pools disabled, but other code should run normally.
Limitations
Limited reporting of tiny allocations
While every single allocation is tracked, for performance reasons only the largest allocations are reported, with a minimum of 99% of allocated memory reported. The remaining <1% is highly unlikely to be relevant when trying to reduce usage; it’s effectively noise.
No support for subprocesses
This is planned, but not yet implemented.
Missing memory allocation APIs
See the list in the page on what Fil tracks.
No support for third-party allocators
On Linux, Fil replaces the standard glibc allocator with jemalloc, though this is an implementation detail that may change in the future.
On all platforms, Fil will not work with custom allocators like jemalloc or tcmalloc.
Getting help
If you need help using Fil:
- You can ask a question in the Discussions tab on GitHub.
- You can also file an issue.