Where’s your bottleneck? CPU time vs wallclock time
If your process is slow it might be because it’s very CPU-intensive—or maybe it’s blocking on I/O (network or filesystem), or locks, or just sleeping. But how can you tell?
There are a variety of answers, but in this article I’m going to cover what is probably the simplest heuristic: comparing CPU time and wallclock time.
I’ll start with showing how to measure it across the full run of your process, and then demonstrate how you can measure it with Python over time.
Wall clock time vs. CPU time
Wall clock time measures how much time has passed, as if you were looking at the clock on your wall. CPU time is how many seconds the CPU was busy.
In order to understand performance you want to compare the two.
For example, the host command sends a DNS query to a DNS server to figure out which mailservers my domain is using:
$ host -t MX pythonspeed.com
pythonspeed.com mail is handled by in2-smtp.messagingengine.com.
pythonspeed.com mail is handled by in1-smtp.messagingengine.com.
Where does this command spend its time?
We can find out at a gross level with the time command that’s available on Unix systems:
$ time host -t MX pythonspeed.com
pythonspeed.com mail is handled by in1-smtp.messagingengine.com.
pythonspeed.com mail is handled by in2-smtp.messagingengine.com.

real    0m0.069s
user    0m0.006s
sys     0m0.005s
The time command runs the arguments given to it, and records three lines of additional output:
real: the wall clock time.user: the process CPU time.sys: the operating system CPU time due to system calls from the process.
In this case the wall clock time was higher than the CPU time, so that suggests the process spent a bunch of time waiting (58ms or so), rather than doing computation the whole time. What was it waiting for? Probably it was waiting for a network response from the DNS server at my ISP.
To put it another way, host is not bottlenecked by the CPU, it’s probably bottlenecked by the network.
I could buy a computer with a CPU that is twice as fast, and that would have very little impact on the time it takes to get back a result.
Important: If you have lots of processes running on the machine, those other processes will use some CPU. If they’re busy enough, the process you’re benchmarking may therefore end up waiting for CPU to be free.
For now just remember that if you’re measuring performance you should try to do that on a quiescent machine with nothing else running. If you’re seriously benchmarking, you might be interested in a technique for reliable benchmarking in the face of noise, and even differing CPU models.
What you can learn from different ratios
In the example above CPU time was lower than wall clock time, but other relationships are possible.
It’s easier to express the possible relationship as a ratio of (CPU time) / (wall clock time), which is to say CPU/second.
If this is a single-threaded process:
CPU/second ≈ 1: The process spent all of its time using the CPU. A faster CPU will likely make the program run faster.CPU/second < 1: The lower the number, the more of its time the process spent waiting (for the network, or the harddrive, or locks, or other processes to release the CPU, or just sleeping). E.g. if CPU/second is 0.75, 25% of the time was spent waiting.
If this is a multi-threaded process and your computer has N CPUs and at least N threads, CPU/second can be as high as N.
CPU/second < 1: The process spent much of its time waiting.CPU/second ≈ N: The process saturated all of the CPUs.- Other values: The process used some combination of waiting and CPU, and which is the bottleneck can be harder to tell with just this measurement. You can get some sense by the number of threads—if you’re running 2 threads and
CPU/second = 2, you know you’re saturated.
CPU usage over time with the psutil Python library
So far we’ve been looking at CPU usage across the whole process run, but we can actually measure it over time.
In Python an easy way to do this is with the psutil library, which lets you get lots of useful information about processes.
You can see system time, user time, and also the respective numbers for child processes:
>>> import psutil
>>> p = psutil.Process(pid=6045)
>>> p.cpu_times()
pcputimes(user=345.45, system=12.8, children_user=220.03, children_system=17.37)
To see changing over time, we can write a little utility that prints out CPU/second every second for an arbitrary process combined with its children:
import sys
import time
import psutil

process = psutil.Process(int(sys.argv[1]))
last_times = process.cpu_times()

while process.is_running():
    time.sleep(1)
    times = process.cpu_times()
    usage = sum(times) - sum(last_times)
    last_times = times
    print("{:.2f} CPU/sec".format(usage))
And we can use it to see how much CPU the process with PID 6045 is using:
$ python cpu-over-time.py 6045
0.03 CPU/sec
0.09 CPU/sec
0.12 CPU/sec
0.40 CPU/sec
0.50 CPU/sec
0.13 CPU/sec
Note: Whether or not any particular tool or technique will speed things up depends on where the bottlenecks are in your software.
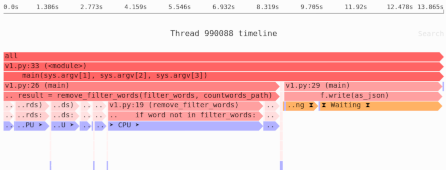
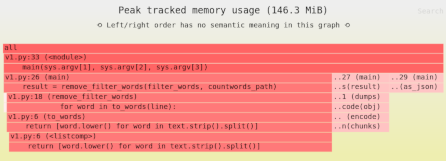
Need to identify the performance and memory bottlenecks in your own Python data processing code? Try the Sciagraph profiler, with support for profiling both in development and production on macOS and Linux, and with built-in Jupyter support.
The narrowest bottleneck is the one to fix
There’s usually no point focusing on CPU-processing optimizations if 90% of the process time is spent waiting for the network. So the first step in performance optimization is always identifying the bottleneck.
And depending on what you’re building, quite often the bottleneck is not the CPU.